The Project Summary report is one of the most popular reports in Avaza. Unlike the Project Dashboard report which can show information for multiple projects at a time, this report runs for one project at a time but provides a comprehensive view of all project metrics on one page. Skim through the summary panels or drill down to the lowest level of information – this report can do it all.
Admins, Portfolio Managers, and Project Managers who have access to cost/billable rates and fixed amounts of a project can view this report.
 Figure: Project Summary Report
A few reasons to use this report:
- For a single project, keep track of all project-related metrics on one page with the ability to drill down to the lowest level. Save & share the report with management.
- For a long-running project, schedule a weekly Project Progress report that gets delivered to senior management and project managers every Monday.
- Keep track of all timesheets, expenses, bills, fixed amounts and invoices linked to a specific project without running multiple reports.
Report Display
The Project Summary report organizes project-related information into 5 tabs:
- Project Budget Hours
- Project Total Hours
- Project Expenses and Bills
- Project Fixed Amounts
- Project Total Amount
In the header of the report Budget Type and Billable Method of the project is displayed
The header of each tab contains a summary of the information inside it.

Figure: Summary Panels – Project Summary Report
Tab 1: Project Budget Hours
This tab gives you a detailed breakdown of your project’s budget and actual.
The summary panel of this tab may be displayed in one of two ways based on the Budget Method you’ve selected for the Project.
For hours based budget types the value of the budget is displyed in amount where possible.
See the below illustration for more details on this.
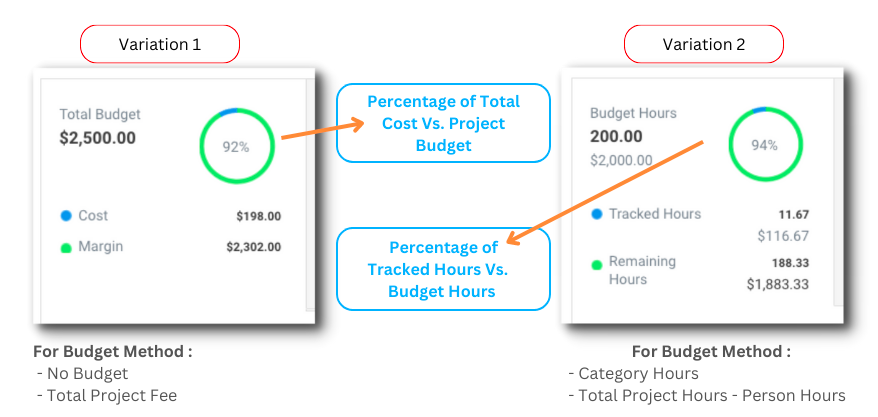 Figure: Variations of Summary – “Project Budget & Actual” Tab
Here’s what you will see in this tab based on the Budget Method you’ve selected for the Project:
Subtab: Timesheets
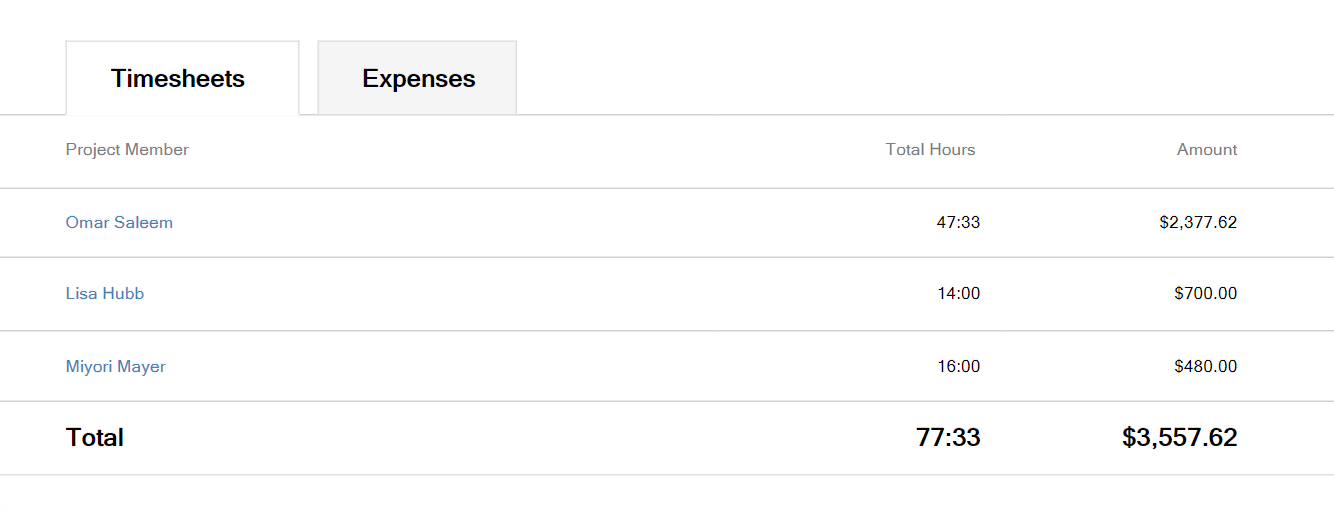
Below are the details of each column shown in this subtab:
- Project Member: Shows name of Project Member
- Total Hours: Shows the sum of hours tracked by the project member (includes both Billable and Non-Billable hours)
- Total Amount: Shows the sum of timesheet cost amount (Total Hours multiplied by Project Member Cost Rate)
You can click on a project member’s name to drill further and see individual timesheets that make up the total.
Subtab: Expenses
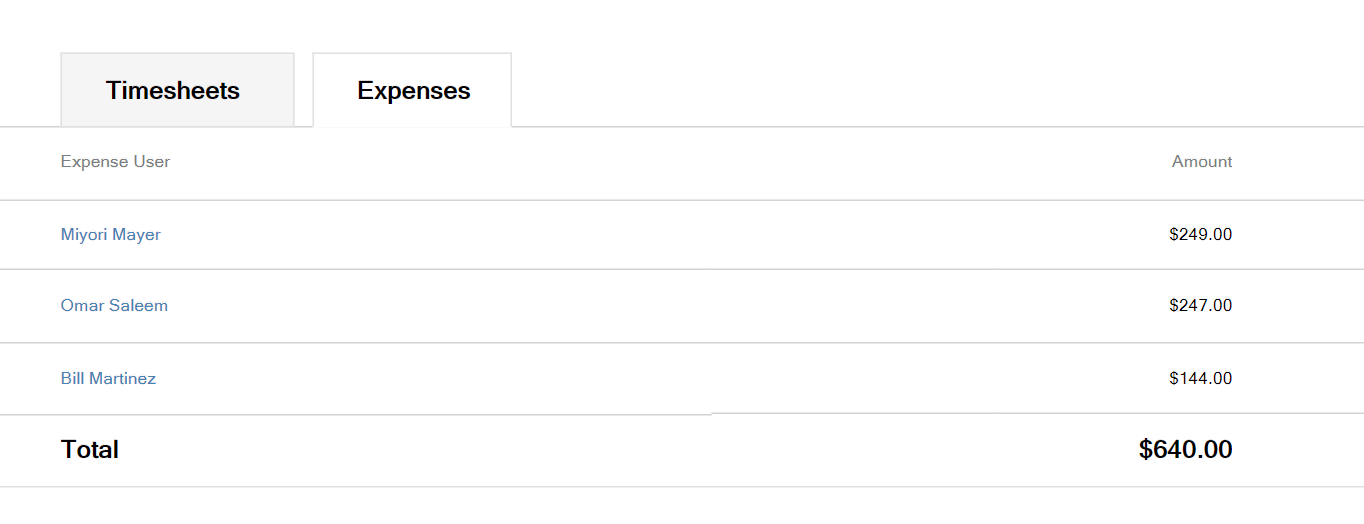
Below are the details of each column shown in this subtab:
- Expense User: Shows the name of the Expense User
- Amount: Shows the sum of expense amount (based on all expenses submitted by the users that are linked to the project). This column only shows before-tax totals in customer currency. Any amounts tracked in currencies other than customer currency will be converted to customer currency based on the exchange rate saved on the expense. [ps2id id=’subtab-team’ target=”/]
The report also includes an Expense subtab for hours based budget types so if an expense budget is configured it can be reviewed.
You can click on any expense user’s name to drill further and see individual expenses that make up the total.
Subtab: Team
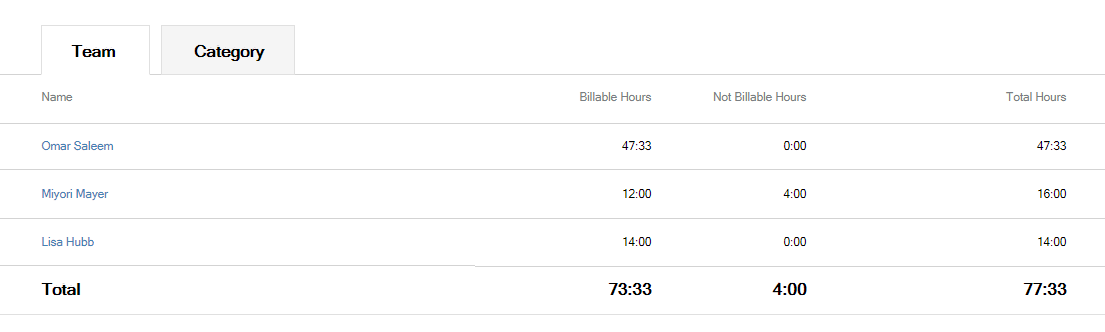
Below are the details of each column shown in this subtab:
- Name: Shows the name of the Project Member
- Billable Hours: Shows the sum of all billable hours submitted by the project member that are linked to the project
- Not Billable Hours: Shows the sum of all non-billable hours submitted by the project member that are linked to the project
- Total Hours: Shows the sum of both Billable and Non-Billable hours submitted by the project member [ps2id id=’subtab-category’ target=”/]
You can click on any team member’s name to drill further and see individual timesheets that make up the total.
Subtab: Category
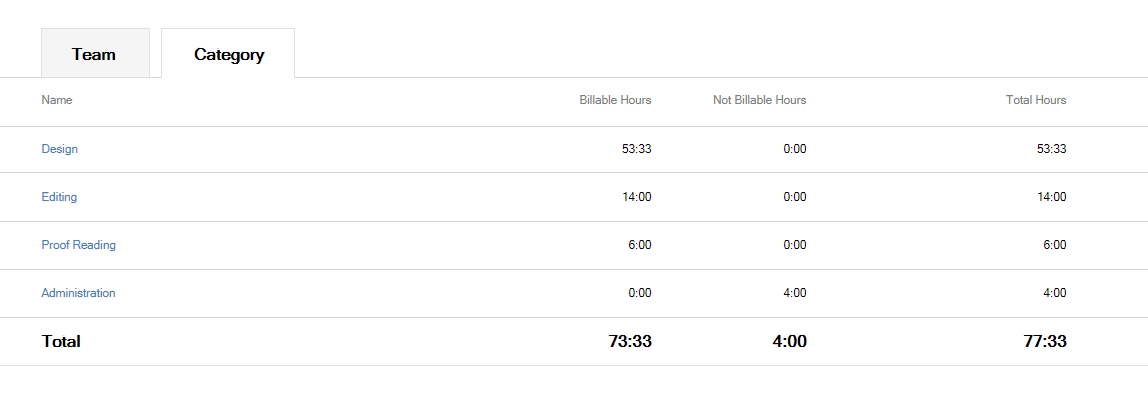
Below are the details of each column shown in this subtab:
- Name: Shows the name of the Timesheet Category
- Billable Hours: Shows the sum of all billable hours submitted against a Timesheet Category
- Not Billable Hours: Shows the sum of all non-billable hours submitted against a Timesheet Category
- Total Hours: Shows the sum of both Billable and Non-Billable hours submitted against a Timesheet Category
You can click on an any Timesheet Category name to drill further and see individual timesheets that make up the total.
Tab 2: Project Total Hours
This tab gives you a detailed breakdown of timesheets tracked against the Project you’re running the report for.
Here’s what you will see in this tab:
- Total Hours: Total hours tracked against the Project
- % of Billable Hours: This doughnut graph shows the percentage of Billable Hours vs. Total Hours tracked against the Project
- Billable: Total billable hours tracked against the Project
- Not Billable: Total non-billable hours tracked against the Project
- Subtab – Team: Learn more
- Subtab – Category: Learn more
Tab 3: Project Expenses and Bills
This tab gives you a detailed breakdown of expenses tracked against the Project you’re running the report for.
Here’s what you will see in this tab:
- Total Expenses and Bills: Total of expense amount for expenses tracked against the Project and total bills amount of bills against the Project.
- % of Billable Expenses: This doughnut graph shows the percentage of Billable Expenses vs. Total Expenses tracked against the Project
- Billable: Total billable expenses tracked against the Project
- Not Billable: Total non-billable expenses tracked against the Project
- Subtab – Team Expenses : Shows breakdown of billable and non-billable expenses by User
- Subtab – Category Expenses: Shows breakdown of billable and non-billable expenses by Expense Category, along with details of Budget, Remaining Budget, and % Budget Remaining for each Expense Category. Expense Category Budgets can be configured in the Project Settings page.
- Subtab- Bills: Shows breakdown of payable and not payable bills.
Tab 4: Project Fixed Amounts
This tab gives you a detailed breakdown of Fixed Amounts recorded against the Project you’re running the report for.
Here’s what you will see in this tab:
- Fixed Amount Tasks: Total of all Fixed Amounts tracked recorded against the Project
- % of Completed Fixed Amount Tasks: This doughnut graph shows the percentage of Fixed Amounts on Completed tasks as compared to total Fixed Amounts
- Complete: Shows total of Fixed Amounts recorded against Tasks that are in a status which falls in the Complete category
- Outstanding: Shows total of Fixed Amounts recorded against Tasks that are in a status which falls either in the “Not Started” or “In Progress” category
- Subtab – Complete: Shows details of Completed tasks on which Fixed Amounts have been recorded. This subtab also shows Uninvoiced Amount, Invoiced %, Invoiced Amount and Total Amount for each task.
- Subtab – Outstanding: Shows details of Outstanding tasks on which Fixed Amounts have been recorded. This subtab also shows Uninvoiced Amount, Invoiced %, Invoiced Amount and Total Amount for each task.
Tab 5: Total Amount
This tab gives you a detailed breakdown of billable timesheets, expenses and fixed amounts for the Project along with their billable status. Invoices that are linked to the project are also shown here.
Here’s what you will see in this tab:
- Total Amount: Shows the sum of all billable amounts for the project.
- % of Invoiced Amount: This doughnut graph shows the percentage of invoiced amount as compared to total amount.
- Invoiced: Shows the sum of invoiced amounts for the project.
- Uninvoiced: Shows the sum of uninvoiced amounts for the project.
- Subtab – Invoices: Shows the details of each invoice that has at least one line item linked to the project
- Subtab – Timesheets: Shows billing-related details of each project member’s billable timesheets
- Subtab – Fixed Amounts: Shows billing-related details of each billable Fixed Amount recorded against the project
- Subtab – Expenses: Shows billing-related details of each project member’s billable expenses recorded against the project
Report Parameters
While this report runs by default for all time, you can choose from custom date ranges, along with other useful report parameters.
Customers: Select the customer you want to run the report for. Since this report runs for one project at a time, you can only select one customer in this parameter.
Projects: Select the project you want to run the report for. Since this report runs for one project at a time, you can only select one project in this parameter. You can only choose a project after a customer has been chosen.
Date Range: This parameter allows you to view the selected project’s progress within a certain date range. For example, if you select “Last Week” in this parameter, the report will only factor in:
- Timesheets that were created in the last week for the selected project
- Expenses that were created in the last week for the selected project
- Fixed Amount Tasks that were created in the last week for the selected project
- Invoices that were created in the last week for the selected project
The only area not impacted by the Date Range parameter is Budget, which stays the same for all date ranges.
The following predefined date range options are available in this parameter:
- This Week
- This Month
- Last Week
- Last Month
- Last 30 Days
- Last 60 Days
- Last 90 Days
- Year to Date
- Last Year
- All Time (selected by default)
- Custom Date Range (allows you to choose a custom date range in the next parameter)
Start & End Date: Enter a custom Start and End date range to run the report for.
Time Format: Choose whether the report output should show hours in hh:mm or hh.mm (decimal).
Rounding [checkbox]: This checkbox applies rounding to the report based on your account settings. This shows you what the durations will look like when added to an invoice. Please note that this parameter only applies to timesheets that are already invoiced. You will see the rounded time durations when you go to the Total Project Amount Tab and then the Timesheet Tab. This sub-report will display rounded time values if this parameter is enabled.
Apply Expense Markup [checkbox]: Check this option to include markup amount when showing Expense Amount in the Invoicing tab of the report. This shows you what the Expense Amount will look like when added to an invoice.
Project Budget based on Linked Invoices [checkbox]: Check this option to use the total value of linked invoice line items as the project budget for running the report. This does not change the actual project budget in Project Settings.
Note: This parameter will only work if the Project Budget is set to “No Budget” or “Total Project Fees” in the Project Settings page for the selected Project.
Use Billable Rate to deduct Timesheets from budget [checkbox]: This option only applies to projects with a budget of Project Fees or No Budget. Check this option if you would like to calculate the tracked time amount based on Billable Rate. If not checked Cost Rate will be used to calculate the tracked time.
Timesheet Status: Filter timesheets to include in report output based on status. By default, the report only includes timesheets that are in Approved, Automatically Approved or Invoiced status.
Expense Approval Status: Filter expenses to include in report output based on status. By default, the report only includes expenses that are in Approved or Automatically Approved status.
Flatten Report Tabs [checkbox]: Ideal for printing this report, this checkbox will split the individual tabs into separate tables for easy exporting.
Deduct Expenses & Bills Amount from budget [Checkbox]: This checkbox is checked by default. This option only applies to projects with a budget of Project Fees or No Budget. Select this option to deduct tracked expenses and bills from the budget amount. If it is unchecked then Expense & Bill Amount will not be deducted from the budget.
Only deduct billable timesheet hours[Checkbox]: This checkbox will be unchecked by default. This checkbox only applies to hours-based budget and if checked will only deduct billable hours from the budget.
Do you need additional help with the Project Summary Report? Please contact our support team via chat or email.