Get overview of expenses for your entire account and review the spending by each expense category.
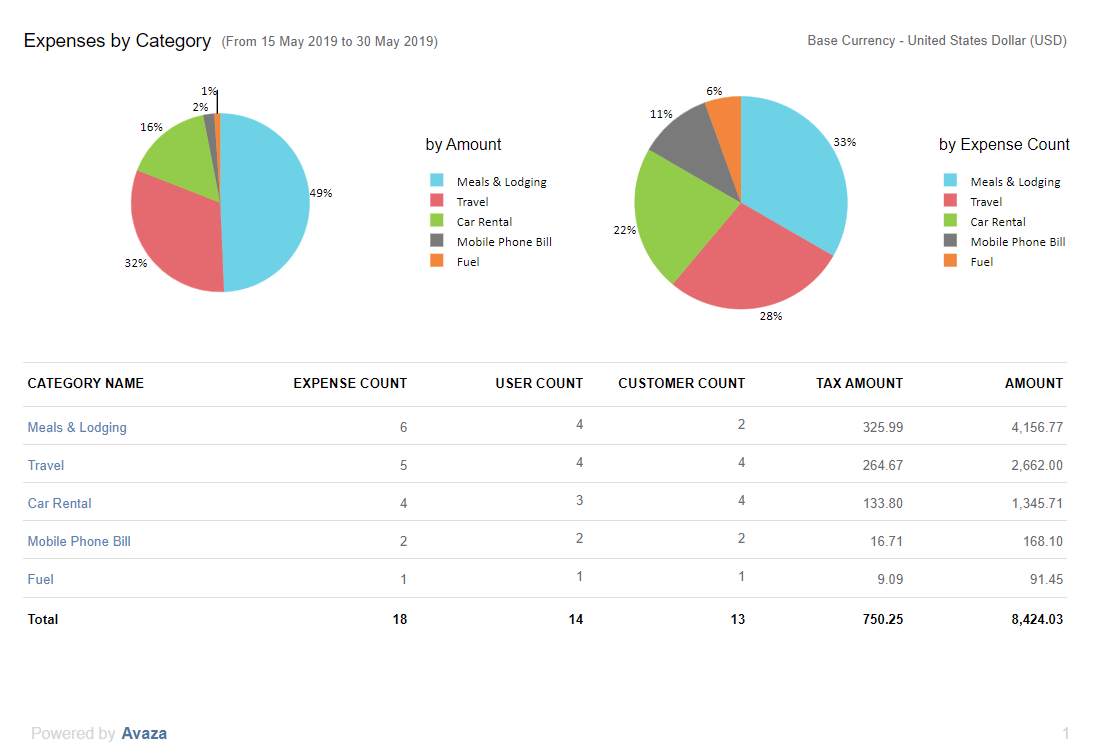 Figure: Expenses by Category Report
A few reasons to use this report:
- Review how different expense categories contribute to the total expenses
- Drill down to review expense details to quickly view the details of each expense
Report Display
By default, this report runs for all time. If date range is selected, it will be displayed at top of the report. This report also displays data in account base currency. To read more about how expenses are converted into account or customer currency, click here. The report is displayed in two sections:
- Pie Charts
- Table
Section 1: Pie Charts
By Amount: This pie chart is broken down to show the proportion of expense amounts by category.
By Expense Count: This pie chart is broken down to show the proportion of expense count by category.
Section 2: Table
The bottom section of the report displays a table with the list of expense categories along with the total amount for expenses they filed. Here are details of columns on the table:
- Category Name: Displays the category name. This allows for drilling down into an expense details report filtered for specific category
- Expense Count: Number of expenses recorded for this category in the selected date range.
- User Count: Number of users who have recorded expenses for the given category.
- Customer Count: Number of customers that expenses have been tracked for.
- Tax Amount: Amount of tax based on the tax code used on the expense.
- Amount: Total expense amount including tax.
Report Parameters
Start Date – End Date: This report allows you to select a date range to filter expenses for.
Do you need further help with this report? Feel free to contact our support team via chat or email.