The Schedule vs Timesheet Report compares scheduled hours with actual hours. It can be used to view actual billable and cost amounts versus those that were projected, as well as analyze projects and teams that deviated from the forecasted values.
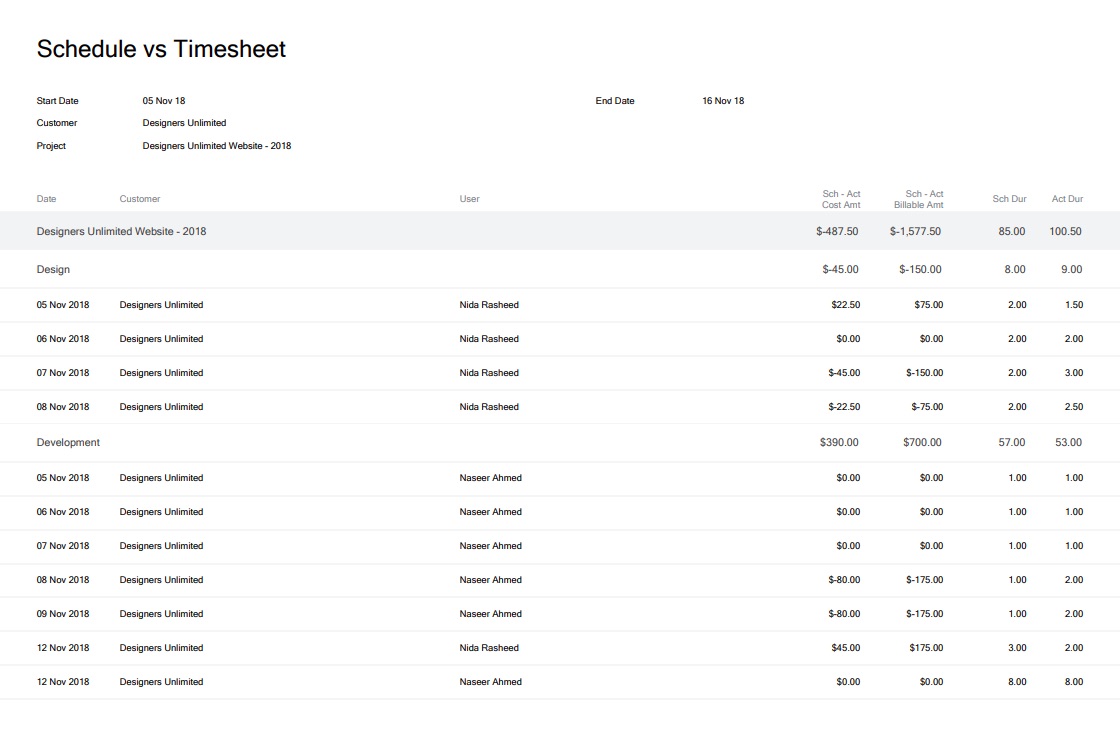 Figure: Schedule vs Timesheet Details Report
A few reasons to use this report
- Get an overview of how well projects are resourced and gain valuable insight into fine-tuning future schedules.
- Determine if the revenue projections for a specific customer/project/period will be met
- Analyze the difference between projected billables and actual billables
- Review team/project/user performance by looking at the scheduled vs actual times, and the associated costs
- Highlight unforeseen activities within a project
Report Parameters.
This report runs by default for last week, it is highly customizable and you can choose from multiple groupings, filters and column options, along with other useful report parameters.
Date Range:
The following predefined date range options are available.
- Next Week
- Next Month
- Next 30 Days
- Next 60 Days
- Next 90 Days
- Next Year
- This Week
- This Month
- Last Week
- Last Month
- Last 30 Days
- Last 60 Days
- Last 90 Days
- Year To Date
- Last Year
- Custom Date Range(allows you to choose a custom date range in the next parameter)
Start & End Date:
Enter a custom date range to run the Schedule vs Timesheets report for. This date range is for the schedule entries.
Groupings
Many of our reports allow you to group data. The Schedule vs Timesheets Report has three available grouping options:
- Primary Grouping
- Secondary Grouping
- Tertiary Grouping
These groupings include the following options:
- Date
- Customer
- Project
- Category
- User
- Task
- Section
- Month
- Billable?
- Week
When data is grouped, the report subtotals all the fields that contain duration, cost or billable amounts. The only exception to this is when a chosen grouping has projects in multiple currencies. In that case amount fields display N/A as amounts from different currencies can’t be added up.
Customers: Select the customer(s) you want to run the report for. You can select one or more customers as needed.
Projects: Select the project(s) you want to run the report for. You can select one or more projects as needed. You can only choose a project after one or more customers have been chosen.
Categories: Filter based on timesheet categories and leave types the schedule bookings are added for. This is very useful if you only need to see a certain type of schedule booking.
Users: Choose specific users you want to run the report for.
Only Billable?: To view only those schedule assignments that have billable timesheet categories, enable the “Only Billable” checkbox.
Rounding: You can also apply rounding to the scheduled assignments and timesheets based on your account settings.
Time Format: Choose between Decimal Hours (H.XX) or Hours Minutes (HH:MM)
Show Columns
- Week
- Month
- Task
- Section
- Billable?
- Project Tags
- Project Category
- Sch – Act Dur
- Cost Rate
- Sch Cost Amt: Shows the cost of the scheduled hours
- Act Cost Amt: Shows the cost of the actual hours
- Sch – Act Cost Amt: Shows the difference between the scheduled and actual costs
- Billable Rate
- Sch Billable Amt: Shows the billable amount for the scheduled hours
- Act Billable Amt: Shows the billable amount for the actual hours
- Sch – Act Billable Amt: Shows the difference between the scheduled and actual billable amounts
You can add up to 11 columns on this report.
Hide Individual Entries [checkbox]: Hide individual schedule and timesheets entries on the report output. The display will only include any available groupings you had selected, as well as the duration and amount fields that can be aggregated on grouping rows.
Project Tags: Filter the projects based on project tags.
Project Categories: Filter projects based on project categories.
Project Archive Status: Use this filter to option to filter the report to see the data for the projects in the selected status(es) only. This is a multi-select field and allows you to see the Actual Hours and Scheduled hours for the projects in Active, Archive, or both the Statuses. Please note that selecting an option from this field also filters the lists in Customers, Projects, Project Categories, Project Tags etc.
User Archive Status: Filter the report to see the Actual and Scheduled hours based on the Archive status of the users. You can use this parameter to filter the report to see the data for Active, Archive, or both types of users. Please note that selecting an option from this field also filters the lists in Customers, Projects, Project Tags, Project Categories, Users, and User Tags parameters.
Note: To view just the scheduled hours in report format, please use Schedule Details Report instead.
We hope this guide was useful. Need further help with the Schedule vs Timesheets report? Please contact our support team via chat or email us on support@avaza.com.