See how your firm’s scheduled utilization measures up against actual utilization.
Use Avaza’s Staff Utilization report to answer questions such as:
- For an established time frame, how many hours was each employee available for?
- What percentage of the available hours was scheduled for work?
- How many hours were actually tracked, and how many of those hours were billable?
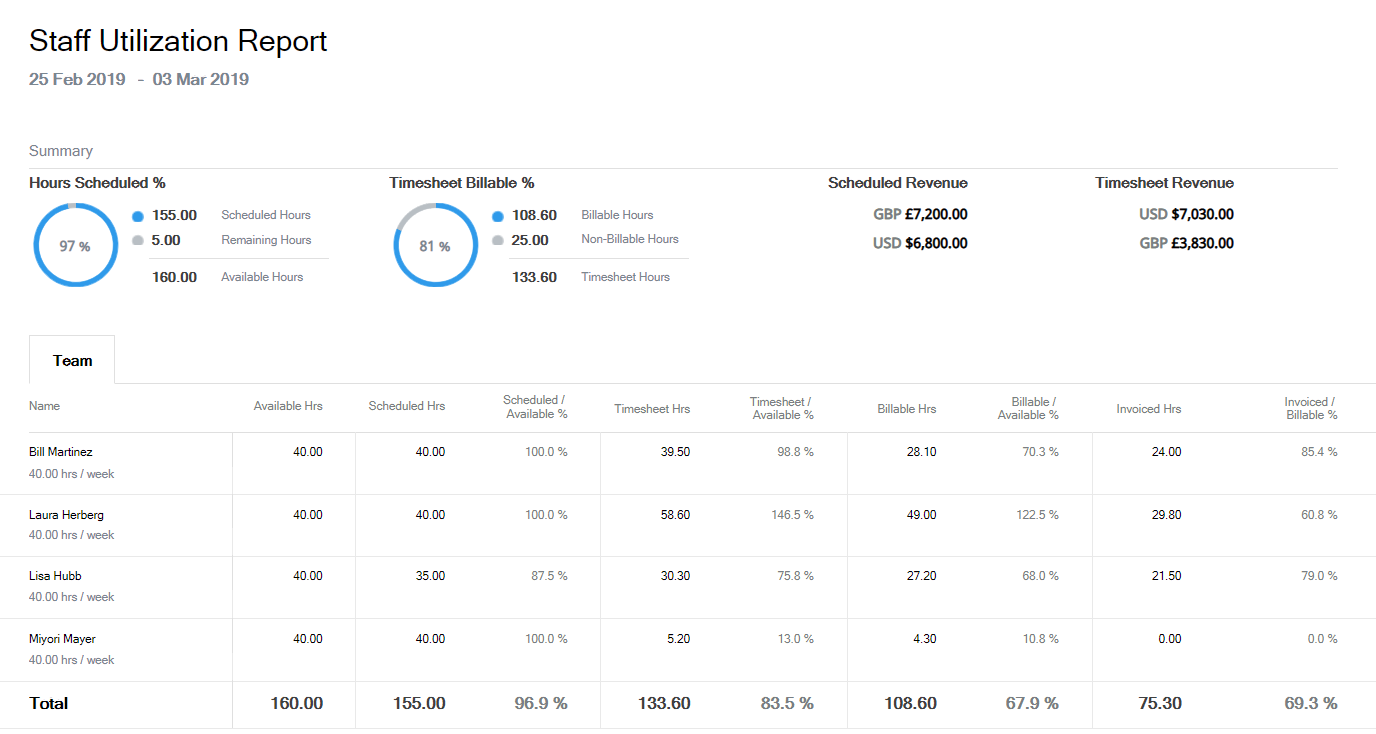
Figure: Staff Utilization Report
A few reasons to use this report:
- Schedule a weekly utilization report for each department, team, or all employees.
- Get a report of all team members who are over or under a specific utilization target.
- Create a report that compares scheduled revenue vs. actual timesheet revenue.
- Make better scheduling decisions by highlighting team members who have been scheduled for less or more than their available hours.
Report Display
Summary Panel
The Staff Utilization report has a summary panel that shows totals for important metrics.
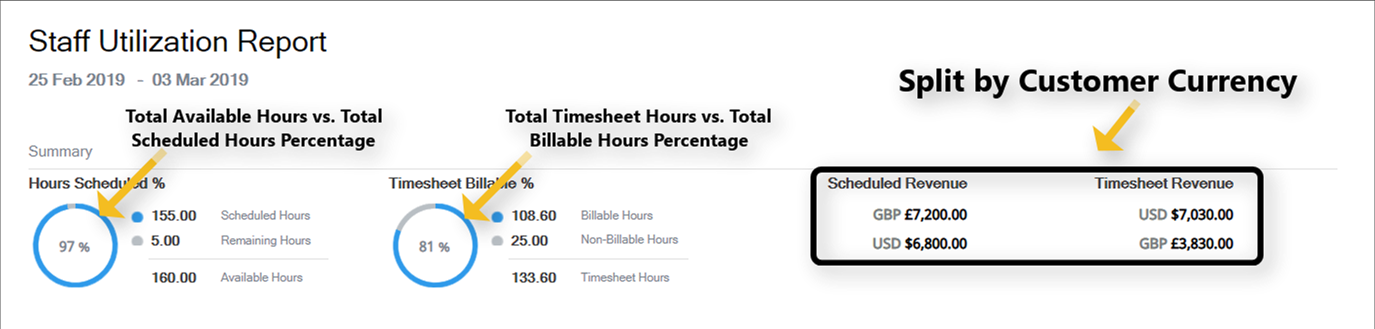 Figure: Summary Panel – Staff Utilization Report
Hours Scheduled %: The doughnut graph displays Total Available Hours vs. Total Scheduled Hours percentage. To its right, we show the values this percentage is based on, along with Total Remaining Hours.
Timesheet Billable %: The doughnut graph displays Total Timesheet Hours vs. Total Billable Hours percentage. To its right, we show the values this percentage is based on, along with Total Non-Billable Hours.
Scheduled Revenue: This section shows how much revenue you would generate based on the hours you’ve scheduled for each team member in a given date range. Values are split by customer currency.
Timesheet Revenue: This section shows how much revenue you have actually generated based on the billable hours each team member has tracked in a given date range. Values are split by customer currency.
“Team” Tab
This tab shows various utilization percentages for each team member you’ve selected.
 Figure: Team Tab – Staff Utilization Report
Here are all the columns you will see in this tab:
Name: Shows name of the user along with their default availability.
Available Hrs: Shows the sum of Available Hours a team member had for the selected date range. Currently we do not factor in leave records for calculating this number.
Scheduled Hrs: Shows the sum of hours a team member was scheduled for in the Resource Scheduling module for the given date range. Currently we include leave records for calculating this number.
Scheduled/Available %: Shows the percentage of Scheduled Hours as compared to Available Hours. This percentage is called “Schedule Utilization”.
Timesheet Hrs: Shows the sum of actual hours a team member tracked for the selected date range.
Timesheet/Available %: Shows the percentage of Timesheet Hours as compared to Available Hours. This percentage is called “Timesheet Utilization”
Billable Hrs: Shows the sum of billable hours a team member tracked for the selected date range.
Billable/Available %: Shows the percentage of Billable Hours as compared to:
- Available Hours (default)
OR - Timesheet Hours (if selected in report parameters)
This percentage is called “Billable Utilization”.
Invoiced Hours: Shows the sum of hours that have been added to an invoice for each team member, for the selected date range.
Invoiced/Billable %: Shows the percentage of Invoiced Hours as compared to Billable Hours. This percentage is called “Invoiced Utilization”.
Report Parameters
Date Range
The following pre-defined date range options are available.
- This Week
- This Month
- Last Week (Default)
- Last Month
- Last 30 Days
- Last 60 Days
- Last 90 Days
- Year to Date
- Last Year
- Next Week
- Next Month
- Next 30 Days
- Next 60 Days
- Next 90 Days
- Next Year
- Custom Date Range (allows you to choose a custom date range in the next parameter)
Start Date / End Date: Enter a custom start date range to run the report for.
User Tags: User Tags can be created and assigned to team members as needed. These can be useful to filter the user list down to just one team, for example design team, customer support etc.
Users: Choose specific users you want to run the report for.
Billable% Based On: Choose whether the report should calculate Billable Utilization based on Available Hours (default) or Timesheet Hours.
Target Utilization
This parameter is composed of three interdependent parameters which allow you to filter out users who are under or over-utilized.
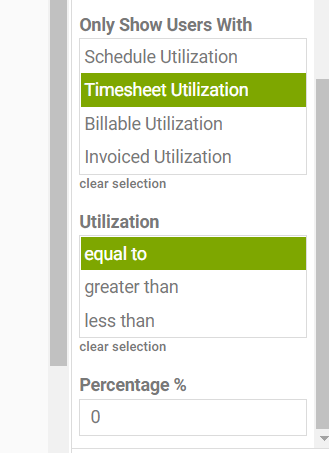
 Figure: Target Utilization Parameter – Staff Utilization Report
Some use cases of this parameter include:
- Get a list of users who have been scheduled for less than/more than 100% of their available hours in a given date range
- Get a list of users who have tracked less than/more than 100% of their available hours in a given date range
- Get a list of users who have submitted less than/more than 100% billable hours against their available or tracked hours in a given date range
In the above examples, you can replace 100% with any number and the report will filter the results for you.
Follow the steps below to use this parameter:
- Select one or more types of utilization to perform the filtering
- Enter a percentage and select whether you wish to filter results that are less than, equal to, or greater than the percentage you entered
For example, if I wanted to filter out users who have submitted no timesheets this week (0% Timesheet Utilization), I would set up the filter as shown below:
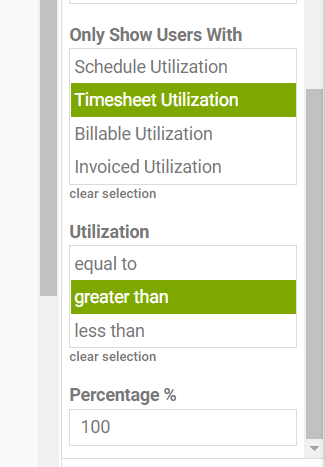
Similarly, if I wanted to filter out users who’ve tracked more time than their available hours (“overtime” or Timesheet Utilization more than 100%), then I would set up the filter as shown below:
Project Categories: This is a multi-select filter that allows you to filter results based on the Project Categories. If one or more Project Categories are selected then the Schedule and Timesheet data will be filtered to display the data for only those Projects that belong to the selected categories.
Customers: Use this filtering option to view the data for specific customers. If one or more customers are selected then the Schedule and Timesheet data will be filtered to only display data for those projects that belong to the selected customers.
Project: This parameter allows you to filter the data based on the selected projects. You can select multiple projects from this dropdown list to see the Schedule and Timesheet data for only the selected projects.
The projects that are displayed in this list are also filtered based on the options selected in the ‘Customers’ and ‘Project Categories’ parameters. If no customers or project categories are selected, then all the projects will be displayed.
Show Columns: From this parameter, you can choose to display the following columns:
- Summary Panel
- Staff Capacity / week
- Position Title
- Available Hrs
- Scheduled Hrs
- Scheduled / Available %
- Timesheet Hrs
- Timesheet / Available %
- Billable Hrs
- Billable / Available %
- Invoiced Hrs
- Invoiced / Billable %
All the options except ‘Position Title’ are pre-selected i.e selected by default when you run the report. The Position Title of each user is displayed in the Name column under the hours per week.
Project Archive Status: Choose whether you wish to run the report for just Active or Archived projects, or both.
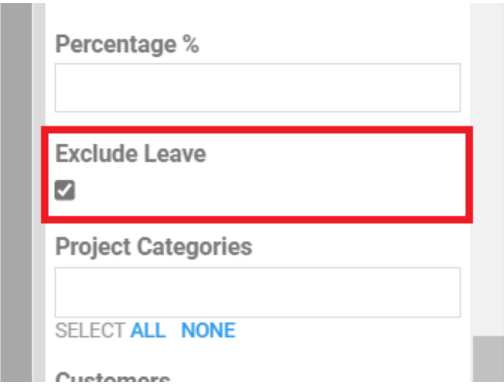
Exclude Leave: When checked, adjusts the Availability & Scheduled hours where staff has scheduled leave records.
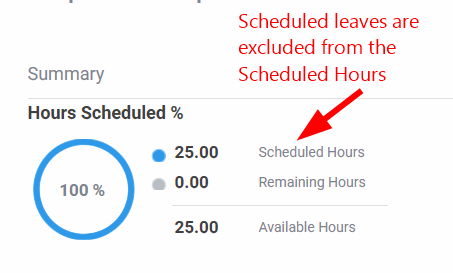
For example, if a user is Scheduled for 40 hours in a particular week where 15 of those hours are scheduled leave records. If the Exclude Leave parameter is not checked, you will see the following:

However, if the Exclude Leave parameter is checked, the amount of Scheduled Hours will exclude 15 hours of leave, as shown here:
We hope this guide was useful. Need further help with the Staff Utilization Report? Please contact our support team via chat or email.