Quickly view expenses across your account in your account currency. See the breakdown by customer, and drill-down to view expense-level details.
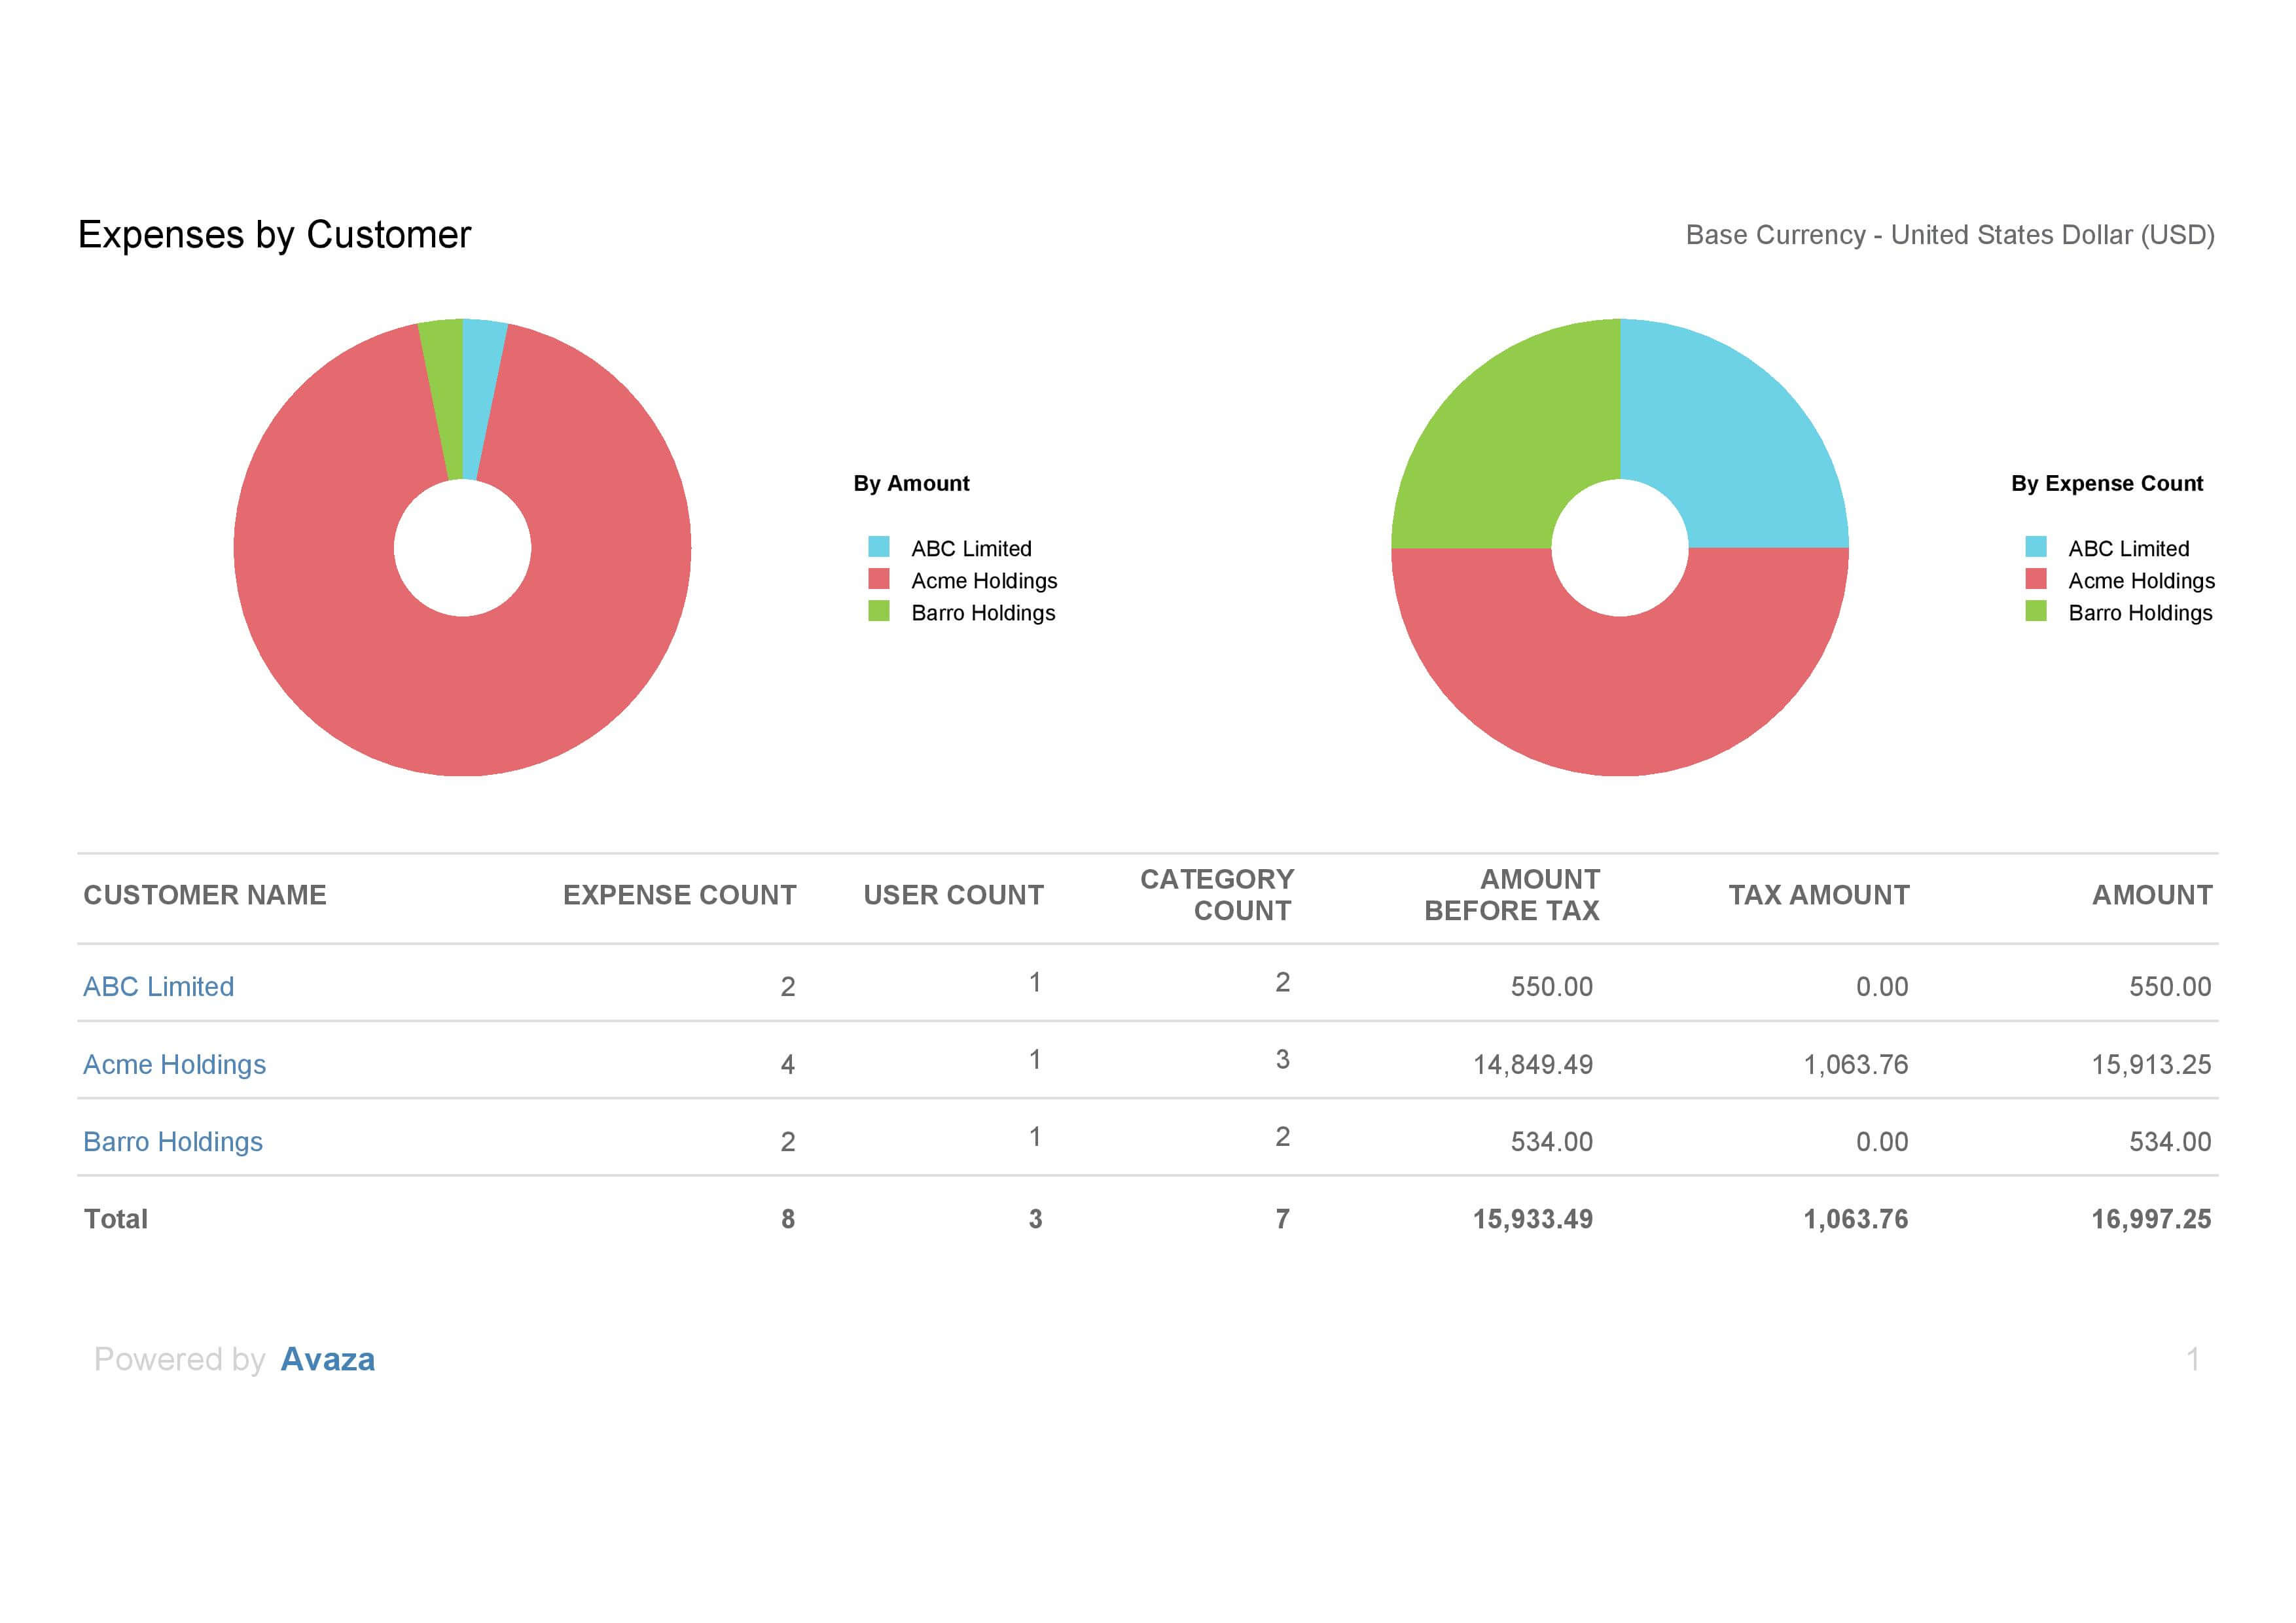 Figure: Expense by Customer (Base Currency) Report
A few reasons to use this report:
- A quick overview of expenses recorded for each customer
- Drill down to review expense details with a filtered Expense Details report
Report Display
By default, this report runs for all time. If a date range is selected, it will be displayed at the top of the report. This report also displays data in account base currency. To read more about how expenses are converted into account or customer currency, click here.
The top panel includes two pie charts.
By Amount: This pie chart is broken down to show the proportion of expense amounts by customer.
By Expense Count: This pie chart is broken down to show the proportion of expense count by customer.
The bottom half of the report is a table displaying:
- Customers: Displays a clickable customer name. You can drill down to the Expense Details report filtered for this customer (and date range) from here.
- Expense Count: Number of expenses recorded for this customer in the selected date range.
- User Count: Number of users who have recorded expenses for this customer in the selected date range.
- Category Count: Number of expense categories that have been used for the customer in the selected date range.
- Amount Before Tax: Total expense amount excluding tax.
- Tax Amount
- Amount: Total expense amount including tax.
Report Parameters
Start Date – End Date: This report allows you to select a date range to filter expenses for.
Do you need further help with this report? Feel free to contact our support team via chat or email.